DNA extraction and gel electrophoresis to determine the length of unknown DNA fragments
The experiment was designed to extract DNA from buccal cells and use gel electrophoresis to determine the length of the unknown DNA fragment. Extract DNA by swishing Gatorade in your mouth, then mixing it with detergent, pineapple juice, and isopropyl alcohol to precipitate the DNA. Extracted DNA is visible at the interface of alcohol and solution. For gel electrophoresis, a DNA sample (including a mixture of dyes, unknown DNA, and DNA markers) is loaded into an agarose gel, and an electric field is applied to separate the fragments by size. The distance the DNA marker migrates can provide an estimate of the length of the unknown DNA fragment. According to the semi-logarithmic standard curve, the results showed that the length of the unknown DNA fragment was approximately 2.7 kb. This experiment successfully demonstrated DNA extraction and electrophoresis, providing insights into molecular biology techniques for DNA analysis.
Gel electrophoresis separates DNA, RNA, or proteins based on size (Hames et al., 1990). Each DNA molecule is a double helix, composed of two complementary strands of nucleotides linked by the base pairs guanine (G)-cytosine (C) and adenine (A)- Thymines (T) are held together by hydrogen bonds. DNA consists of a negatively charged phosphate backbone that causes migration toward the positive electrode under the influence of an electric field (Alberts et al., 2002). Dyes such as ethidium bromide and SmartGlow Pre Stain (a non-carcinogenic alternative) visualize DNA by fluorescing under ultraviolet light. The speed at which molecules move through gel pores is inversely proportional to their length; smaller fragments migrate faster (Mika et al., 2024).
Agarose gels are primarily used in gel electrophoresis, where an electric field is applied to separate biomolecules based on their size and charge. The gel matrix acts as a molecular sieve, allowing smaller molecules to migrate faster than larger molecules. Agarose gel is a gel-like substance extracted from agar; a polysaccharide obtained from red algae. It is widely used in the separation and analysis of nucleic acids (DNA and RNA) and proteins in molecular biology. Gel concentration affects pore size and resolving power, and migration distance can be plotted against the logarithm of the molecular length. DNA markers or ladders contain fragments of known size that can be used to accurately estimate the size of unknown samples by comparing migration distances. By building a standard curve from molecules of known length, the length of unknown DNA can be calculated, usually expressed in kilobases (kb) or base pairs (bp) (Lee et al., 2012).
The purpose of this experiment is to measure the length of an unknown DNA fragment by analyzing its electrophoretic migration with a standard DNA fragment of known length.
If an unknown DNA fragment migrates similarly to a standard DNA fragment of known length, its size can be estimated based on this comparison.
Buccal cell DNA extraction
Extracting DNA from cheek cells involves swishing 5 ml of Gatorade in your mouth for 2 minutes and then transferring the solution to a test tube. After adding 2 ml of dish soap and swirling the tube to mix, add 2 ml of pineapple juice to the solution. Invert tube to mix. Next, gently add 2 ml of ice-cold isopropanol and leave the tube for 10 minutes to precipitate the DNA (Mika et al., 2024).
Preparation of agarose gel
For the next experiment, prepare the agarose gel in advance and store it with a gray plastic comb. Once the gel has set, carefully remove the comb and save it for reuse. Each student is assigned a specific gel and electrophoresis apparatus, and the chamber is designed to hold a type of gel. When loading samples, it is recommended to skip the end wells to prevent contamination, and students are encouraged to load two samples of each DNA type as needed.
agarose gel electrophoresis
Each gel was loaded with three types of samples: dye mixture, unknown DNA, and DNA markers, with each well holding approximately 25 µL of sample.
DNA samples were prepared and frozen prior to experiments. To load samples, use a micropipette equipped with disposable pipette tips. Dip the tip into the sample solution and press the thumb button to draw 25 µL of sample into the tip. Carefully inspect and expel any air bubbles before carefully inserting the pipette tip into the submerged well of the gel. Each well was filled to 25 µL capacity without spillage, and a new pipette tip was used for each sample to avoid cross-contamination. After loading, return the vial to the refrigerator.
After loading the DNA sample, place the gel in the electrophoresis chamber with the hole closest to the black (negative) electrode, ensuring that the DNA moves toward the red (positive) electrode. Prepare and cool a buffer solution (0.04 M Tris-Acetate EDTA, pH 8.0) beforehand, then add approximately 200 mL of cold buffer to completely cover the gel and eliminate any trapped air bubbles. Gently place the orange lid on top, adjusting as needed.
Place an 8-cm clear ruler on the lid, aligned with the wells, to visually monitor DNA migration. Then connect the gel electrophoresis device to a power source and adjust settings to run at 100 volts for 35 minutes. The timer has been set, confirm all parameters and press the start button. Observe the progress of DNA migration by turning on a blue LED light beneath the chamber, which illuminates the strip as it exits the well.
Continue electrophoresis until the dye mixture moves within 2-3 mm of the end of the gel. After the run is complete, turn off the device and disconnect the cables. The gel was visualized under blue LED light, and pictures were taken using a black imaging box with an orange filter affixed to its lid. Carefully align the camera with the ruler to accurately measure the strips.
data analysis
After imaging, use a ruler to measure the distance in millimeters that the DNA labeled fragments have migrated. Results are recorded in designated tables for analysis. This distance is plotted on a semi-log plot against the known size of the DNA marker to estimate the length of the unknown fragment in kilobases (kb). Measure the migration distance of the unknown DNA fragment from the well to the leading edge of the band. Using the standard curve, the corresponding value on the x-axis of the graph is the length of the unknown DNA fragment (Mika et al., 2024).
Simplified protocol
Extract DNA from cheek cells:
- Place 5 mL of Gatorade in your mouth and swish for 2 minutes.
- Transfer the solution to a test tube.
- Add 2 mL dishwashing detergent and swirl to mix.
- Add 2 mL of pineapple juice and invert the tube to mix.
- Gently add 2 mL of ice-cold isopropyl alcohol.
- Leave the tube for 10 minutes to pellet the DNA.
Agarose gel electrophoresis:
- Prepare the agarose gel in advance and store it with a gray plastic comb.
- Once the gel has set, carefully remove the comb for reuse.
- Assign each student a specific gel and electrophoresis setup.
- Skip the end wells when loading to avoid contamination.
- Load three types of samples into the wells: dye mixture, unknown DNA, and DNA markers (25 µL per well).
- Prepare and freeze DNA samples before experiments.
- Use a micropipette with disposable tips to load samples into the wells.
- Make sure there are no air bubbles in the pipette tip and use a new tip for each sample.
- Make sure the gel is in the electrophoresis chamber with the hole close to the black (negative) electrode.
- Prepare and cool 200 mL of buffer solution (0.04 M Tris-Acetate EDTA, pH 8.0) in advance.
- Add freezing buffer to completely cover the gel and remove air bubbles.
- Place the orange cover on the electrophoresis chamber and adjust if necessary.
- DNA migration was monitored visually using an 8-cm clear ruler, aligned with the wells.
- Set the electrophoresis device to 100 volts for 35 minutes.
- Use the blue LED light below the chamber to observe DNA migration.
- Continue electrophoresis until the dye mixture is 2-3 mm from the end of the gel.
- After operation, switch off the device and disconnect the cables.
- Observe the gel under blue LED light and take pictures using a black imaging box with an orange filter.
- Align the camera with the ruler to accurately measure the strips.
Data analysis:
- Use a ruler to measure the distance (in millimeters) traveled by the DNA labeled fragments.
- Record the measurements in a table for analysis.
- Migration distances are plotted on a semi-log plot based on known DNA marker sizes.
- Use the standard curve to estimate the length of the unknown DNA fragment in kilobases (kb).
result
DNA extracted from cheek cells precipitated successfully and was visible at the interface of alcohol and solution in the test tube.
Measures the distance traveled by a labeled fragment of DNA. Distances are plotted in semi-log plots.
| DNA Number of marked segments | DNA Manufacturer fragment length (KBP) | DNA Migration distance of marked fragments (mm) |
| 1 | 23.13 | 18 |
| 2 | 9.41 | 25 |
| 3 | 6.68 | 30 |
| 4 | 4.36 | 38 |
| 5 | 2.32 | 58 |
| 6 | 2.03 | 63 |
Table 1: DNA marker fragment lengths
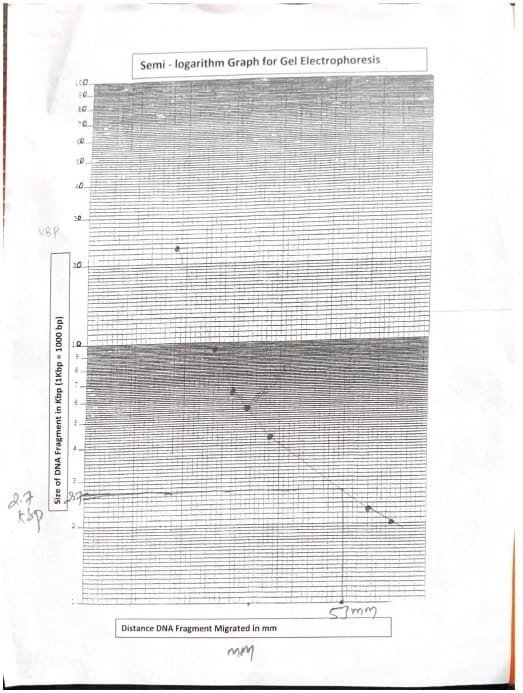
Measure the distance traveled by the unknown DNA fragment and identify the fragment length by comparing it to the corresponding value marked on the semi-log paper.
| Unknown DNA fragment migrated (mm) | Unknown DNA fragment length (KBP) |
| 53mm | 2.7 g BP |
Table 2: Unknown DNA fragment length determination
discuss
DNA was extracted from buccal cells by adding various solutions, which facilitated its precipitation and made it visible at the interface of alcohol and solution in the test tube. DNA molecules are too small to visualize and can only be seen using electron microscopy, but clumping makes them visible (Mika et al., 2024).
Gel electrophoresis experiments using agarose gel as a medium effectively demonstrated size-based separation of DNA fragments (Hames et al., 1990). 0.04 M Tris-Acetate EDTA buffer at pH 8.0 promotes the movement of negatively charged DNA toward the positive electrode (Alberts et al., 2002). A standard curve constructed from known DNA markers allowed us to estimate the length of the unknown fragment to be approximately 2.7 kb.
Clear separation of the dye mixture confirms the integrity of the electrophoresis process and shows that the gel is functioning properly. Visualization under blue light enables clear imaging of DNA bands, and careful alignment with a ruler ensures accurate distance measurement.
Overall, this experiment successfully illustrates the principles of gel electrophoresis and highlights the importance of clean sample preparation and experimental conditions for reliable results. Future studies could investigate different agarose concentrations or incorporate additional control groups to further enhance the analysis.
refer to
- Harms, B. D., & Rickwood, D. (1990). Nucleic acid gel electrophoresis: a practical approach. Oxford University Press.
- Albert B, Johnson A, Lewis J et al. Molecular Biology of Cells. Fourth edition. New York: Garland Science; 2002. Available at: https://www.ncbi.nlm.nih.gov/books/NBK26821/
- Mika (TA), Klein (RJ), Brejan (AE), Connaugh (RL), Swimmer (LM), White (R).
- In E., Gosses, MW, Carter, TE, Andrews, AM, Maier, JL, & Sidiq, F. (Eds.). (2024). Anatomy and Physiology BIO 211 Laboratory Manual (3rd ed.). Owens Community College.
- Lee, PY, Costumbrado, J., Hsu, CY, & Kim, YH (2012). Agarose gel electrophoresis is used to separate DNA fragments. Journal of Visual Experiments: JoVE(62), 3923.

: a research-oriented overview")
